New interactive neighbourhood services map launches in Waterloo Region
Posted Jan 13, 2026 05:00:00 AM.
Last Updated Jan 13, 2026 11:49:37 AM.
As Waterloo Region prepares to be home to one million people by 2050, a new services map is breaking down how accessible services are in neighbourhoods around the region.
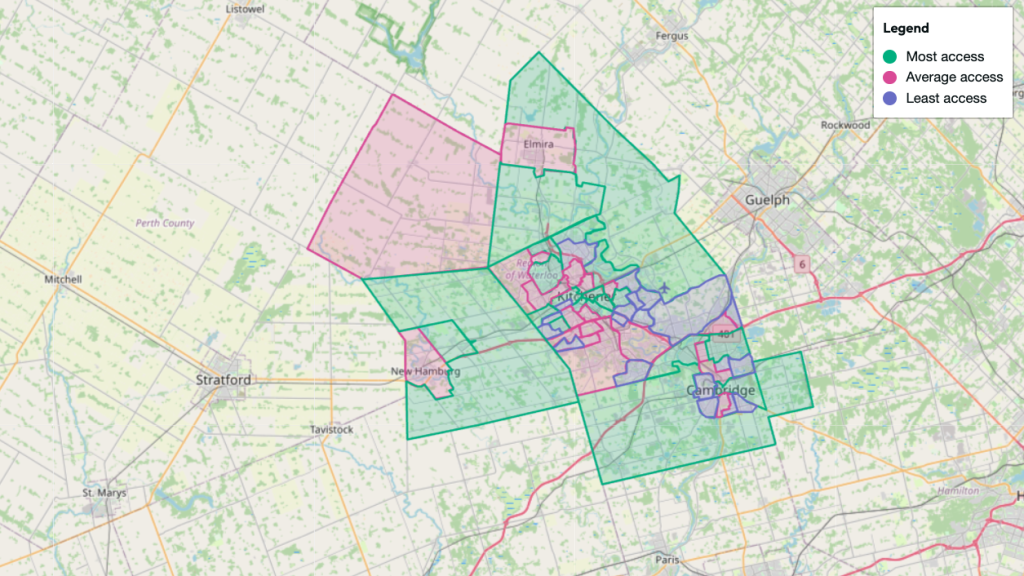
One Million Neighbours WR launched its new Neighbourhood Services Map on Monday. The interactive map ranks each neighbourhood in all municipalities on various factors, including health care, transit, green spaces, schools, libraries and green spaces. Areas are ranked as either “most access” in green, “average access” in red and “least access” in blue.
It was developed by several non-profit and community groups across the region, in collaboration with Civic Tech WR, a volunteer group of software and data professionals.
Sam Nabi, the project coordinator with One Million Neighbours WR, said they managed to get the data for the map from the census as well as data from Open Street Map. The census provided details on where the boundaries of each neighbourhood are, as well as more recent population counts, while Open Street Map has data on a lot of apps people may use for directions and finding businesses in their area.
“There’s a range of open data that we collected there specifically tailored to the priorities of the non-profit groups that contributed to our vision document,” said Nabi.
“Things like green spaces really came up as important at a neighbourhood level. Things like community spaces are super important for having neighbourhoods where people can have opportunities where they can connect and belong.”
Initial findings as a result of using the new tool suggest cities like Kitchener and Waterloo are better equipped than Cambridge, but there are pockets in all those cities that have areas listed as “least accessible.” For example, in Kitchener, the Forest Heights area is ranked as “most access” but Forest Heights West is ranked as “least access” despite being next to each other.
Rural areas, such as Elmira, New Hamburg and Wellesley, rank very well on factors like green spaces and community centres, but fall behind when it comes to resources like transit and health care access.
Nabi points out that population growth plays a key role in ratings in how neighbourhoods are adapting with services.
“If we look at some neighbourhoods that are newer, such as the northwest corner of Waterloo or the southwest area of Kitchener, you’ll see on the map that those are areas that have a lot of population growth but a lot of the services haven’t caught up yet.”
The two main beneficiaries of this tool are governments and local grassroots community organizations, Nabi notes. Governments can use the data to help develop policy when it comes to updating strategic plans for parks or transportation, while community groups can use it as a “gut check” for data that matters in their neighbourhood.
“If you’re getting together with your neighbours and you realize you want to advocate for more park space, more child care services or community centre hours, this map can hopefully provide some more additional context within the region to see where these services are being equitably provided,” said Nabi.
One Million Neighbours WR will be working with developers and local community groups to update the map at least once a year.